

Generative Adversarial Networks (GANs) have taken over the public’s imagination – throughCelebrities produced by AI comeAttracting popular culture and creating it in high-end art auctionsSold in thousands of dollarsartwork.
In this article, we will explore:
- AboutGANBrief introduction
- Understanding and evaluating GAN
- Run your own GAN
There are enough resources to catch up with GAN, so our focus on this article is to understand how to evaluate GAN. We will also guide you through running your own GAN to generate handwritten numbers such as MNIST.

Brief introduction to GAN
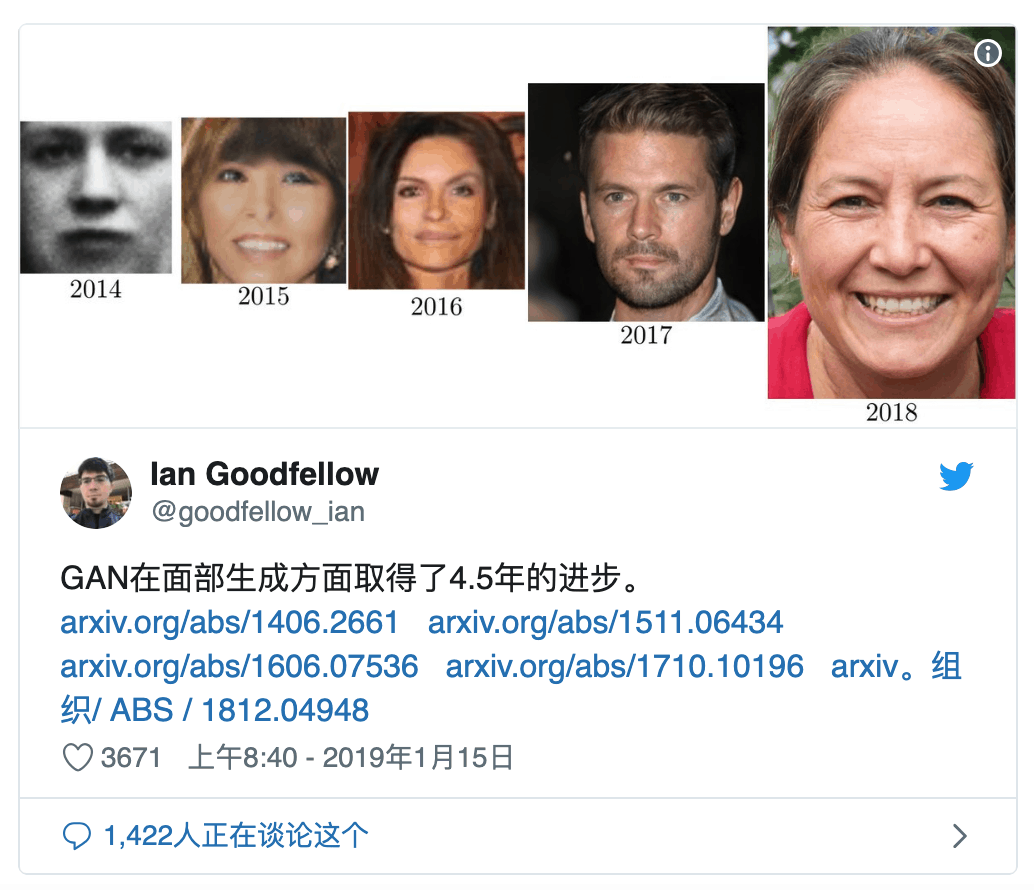
Ian Goodfellow from 2014 Year Generative Adversarial Networks Since the establishment of the paper, the progress of GAN has exploded and the output has become more and more realistic.
Just three years ago, you can find Ian GoodfellowThis Reddit themeThe reply asks the user if you can use GAN as the text:

"GAN has not been applied yetNLPBecause GAN is only defined for real-valued data. The GAN works by training a generator network that outputs synthetic data and then running a discriminator network on the synthesized data. The gradient of the output of the discriminator network relative to the gradient of the synthesized data tells you how to slightly change the synthesized data to make it more realistic. Substantial changes can only be made to synthetic data when it is based on consecutive numbers. If it is based on discrete numbers, no minor changes can be made. For example, if you output an image with a pixel value of 1.0, you can change the pixel value to 1.0001 in the next step. If you output the word "penguin", you cannot change it to "penguin + .001" in the next step because there is no word like "penguin + .001". You have to go all the way from "penguins" to "ostriches." Since all NLPs are based on discrete values, such as words, characters or bytes, no one really knows how to apply GAN to NLP. "
GAN is now used to create a variety of content, including images, video, audio and (yes)text. These outputs can be used to train synthetic data for other models, or just to generate interesting side items, such asThispersondoesnotexist.com.Thisairbnbdoesnotexist.com/,andThis machine learning media post does not exist. 😎
Behind GAN
GAN consists of two neural networks-one that synthesizes new samples from scratchgenerateAnd a comparison of the training samples with the generated samples from the generatorIdentificationDevice. The goal of the discriminator is to distinguish between "real" and "false" inputs (ie, if the samples are from a model distribution or a true distribution, then the classification is performed). As we said, these samples can be images, videos, audio clips and text.
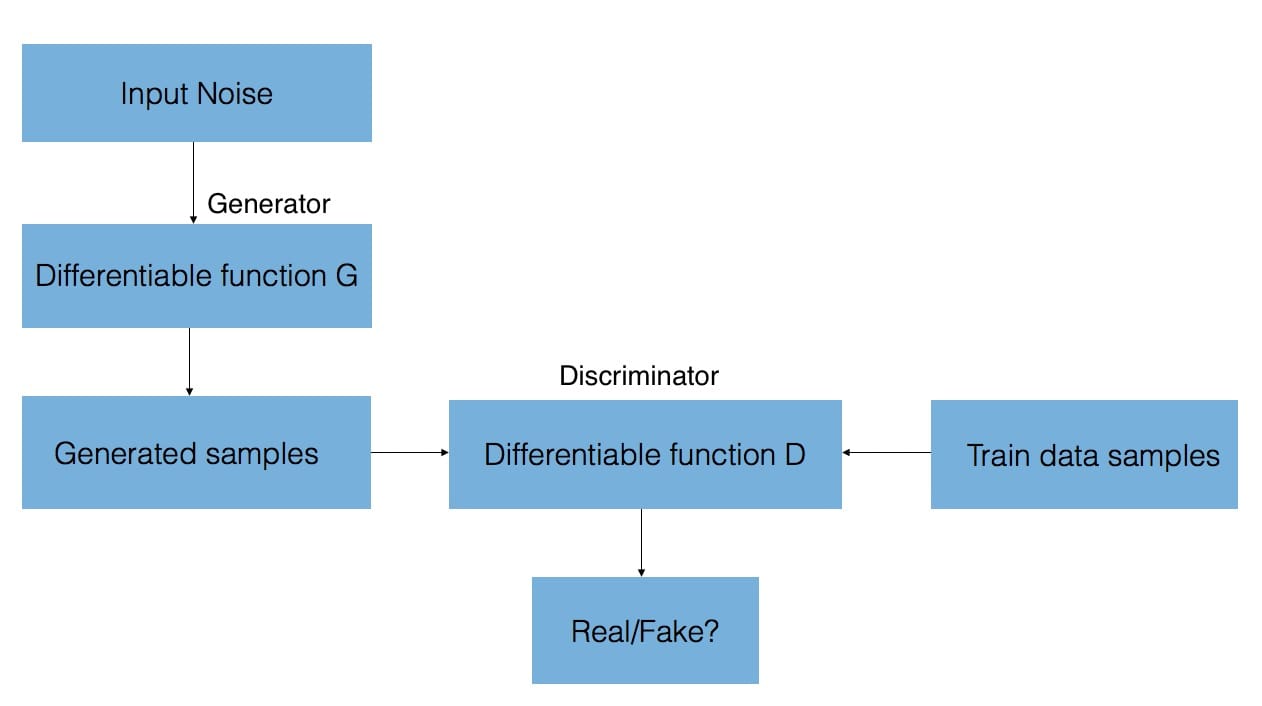
To synthesize these new samples, the generator is given random noise and attempts to generate realistic images from the learned training data distribution.
The output of the discriminator network (convolutional neural network) relative to the gradient of the synthesized data informs how the synthesized data is slightly changed to make it more realistic. Eventually, the generator converges on the parameters that reproduce the actual data distribution, and the discriminator cannot detect the difference.
You can view and use these fused data distributions through the GAN Lab:GAN Lab: Use a build-up against your network in your browser!
GAN Lab was created by Minsuk Kahng, Nikhil Thorat, Polo Chau, Fernanda Viégas and Martin Wattenberg. This is...Poloclub.github.io
Here are the best guidelines for GAN:
- Stanford CS231 Lecture 13-Generative Model
- Style-based GAN
- Understanding the Generating Confrontation Network
- Generate a confrontation network introduction
- Lillian Weng: From Gan to WGAN
- First sneak into the advanced GAN: explore self-focus and spectrum specifications
- Guim Perarnau: The magical GAN and where to find them(first and second parts)
Understanding and evaluating GAN
Quantifying the progress of GAN can feel very subjective – "Does this generated face look realistic enough?", "Are these generated images sufficiently diverse?"- And GAN may feel like a black box, where it is not clear which components of the model affect the quality of learning or results.
To this end, a team at the Massachusetts Institute of Technology's Computer Science and Artificial Intelligence (CSAIL) lab recently published a paper. GAN Anatomy: Visualization and understanding of the generative confrontation network "This paper introduces a relationship between images and objects that visualize how GAN and GAN units relate to objects.

Using segmentation-based network profiling, the framework of this paper allows us to dissect and visualize the internal workings of the generator neural network. This is done by finding a protocol between a set of GAN units (called neurons) and concepts in the output image (eg, trees, sky, clouds, etc.). Therefore, we are able to identify neurons that are responsible for certain objects, such as buildings or clouds.
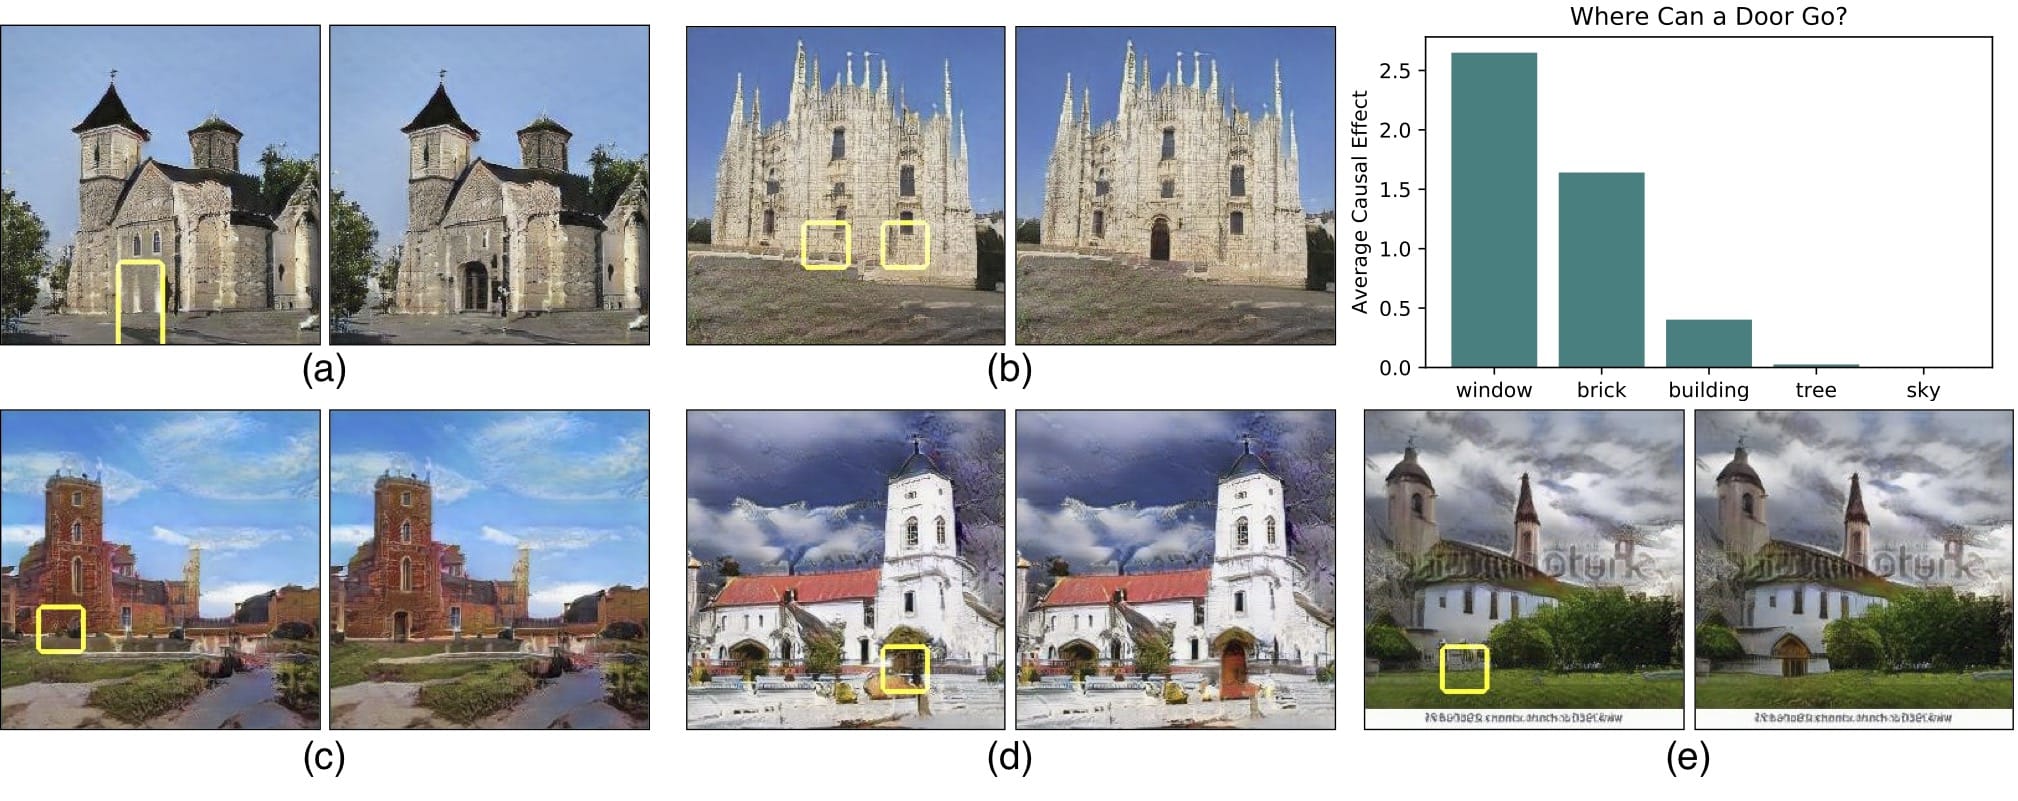
Placing this level of granularity into neurons allows existing images to be edited (eg, adding or removing trees shown in the image) by forcing activation and deactivation (ablating) the corresponding elements of these objects.
However, it is not clear whether the network can infer objects in the scene, or whether it is just remembering them. One way to approach the answer to this question is to try to distort the image in an unrealistic way. MaybeMIT CSAIL's GAN Paint interactive web demoThe most impressive part is that the model seems to be able to limit these edits to "realistic" changes. If you are trying to put the lawn on the sky, this is what happens:
Even if we activate the corresponding neurons, it appears that GAN has suppressed the signals in subsequent layers.
Another interesting way to visualize GAN is toPotential spatial interpolation(Remember, GAN generates new instances by sampling from the potential space of learning). This can be a useful way to see the degree of smooth transition between generated samples.

These visualizations can help us understand the internal representation of GAN, but finding quantifiable methods to understand GAN progress and output quality is still an active area of research.
Two common assessment metrics for image quality and diversity are:Initial score和Fréchet initial distance (FID). Shane Barratt and Rishi Sharma's main shortcomings in the former上Published their papers" About the initial scoreOfComment",Most practitioners have switched from initial scores to FID.
Initial score
Invented by Salimans et al. 2016 Year" For training GANOfImproved technology The initial score is based on a heuristic approach, ie when passing through a pre-trained network (eg Inception on ImageNet), the real-world samples should be able to be classified. Technically, this means that the samples should have low entropy softmax Forecast vector.
In addition to high predictability (low entropy), the initial score also evaluates the GAN (eg, the high variance or entropy of the distribution of generated samples) based on the diversity of generated samples. This means that there should be no dominant class.
If both features are met, there should be a large initial score. The method combining these two criteria is to estimate the Kullback-Leibler (KL) difference between the conditional label distribution of the sample and the marginal distribution of all samples.
Fréchet starting distance
ByHeusel et alIntro.2017The FID estimates the realism by measuring the distance between the generated image distribution and the true distribution. The FID embeds a set of generated samples into the feature space given by a particular initial network layer. The embedded layer is treated as a continuous multivariate Gaussian and then the mean and covariance of the generated data and the actual data are estimated. The Fréchet distance (aka Wasserstein-2 distance) between the two Gaussians is then used to quantify the quality of the generated sample. The lower FID corresponds to a more similar actual and generated sample.
An important consideration is that the FID needs a suitable sample size to produce good results (recommended size = 50k sample). If you use too few samples, you will eventually overestimate your actual FID and the estimates will vary greatly. For the beginning of the establishment and the score FID how to compare across different documents, see Nie Jien's post
Want to see more?
Aji Borji's paper " GAN assessment measuresOfpros and cons "Includes an excellent form that more fully covers the GAN assessment indicators:
Interestingly, other researchers take different approaches by using domain-specific assessment indicators.For the text GAN, Guy Tevet and his team propose to use traditional probability-based language model metrics to evaluate GAN in their papers. Evaluation text GAN as a language model The distribution of the text generated in .
in' How good is my GAN?', Konstantin Shmelkov and his team used two methods based on image classification, GAN-train and GAN-test, which approximated the recall (diversity) and accuracy (image quality) of GAN respectively. You can research papers in Google Brain" GANS creates the same Seeing these metrics, they used a triangular dataset to measure the accuracy and recall of different GAN models.

Run your own GAN
To illustrate GAN, we will adjust Wouter Bulten'sThis excellent tutorial.The tutorialUse the Keras and MNIST data sets to generate written numbers.
OnHereCheck out the full tutorial notebook.
The GAN model generates MNIST training data and random noise as inputs (specifically, random vectors of noise):
- Image (in this case, a handwritten digital image).Ultimately, these generated images will be similar to the data distribution of the MNIST data set.
- The discriminator predicts the generated image
Saidgenerator和IdentificationThe models together form a confrontation model - in this example, and if the image generated by the confrontation model as an output is classified as a generator that is actually used for all inputs, it will be executed.
View the full codeit's hereAnd full comet experimental results andthis
Track the progress of the model
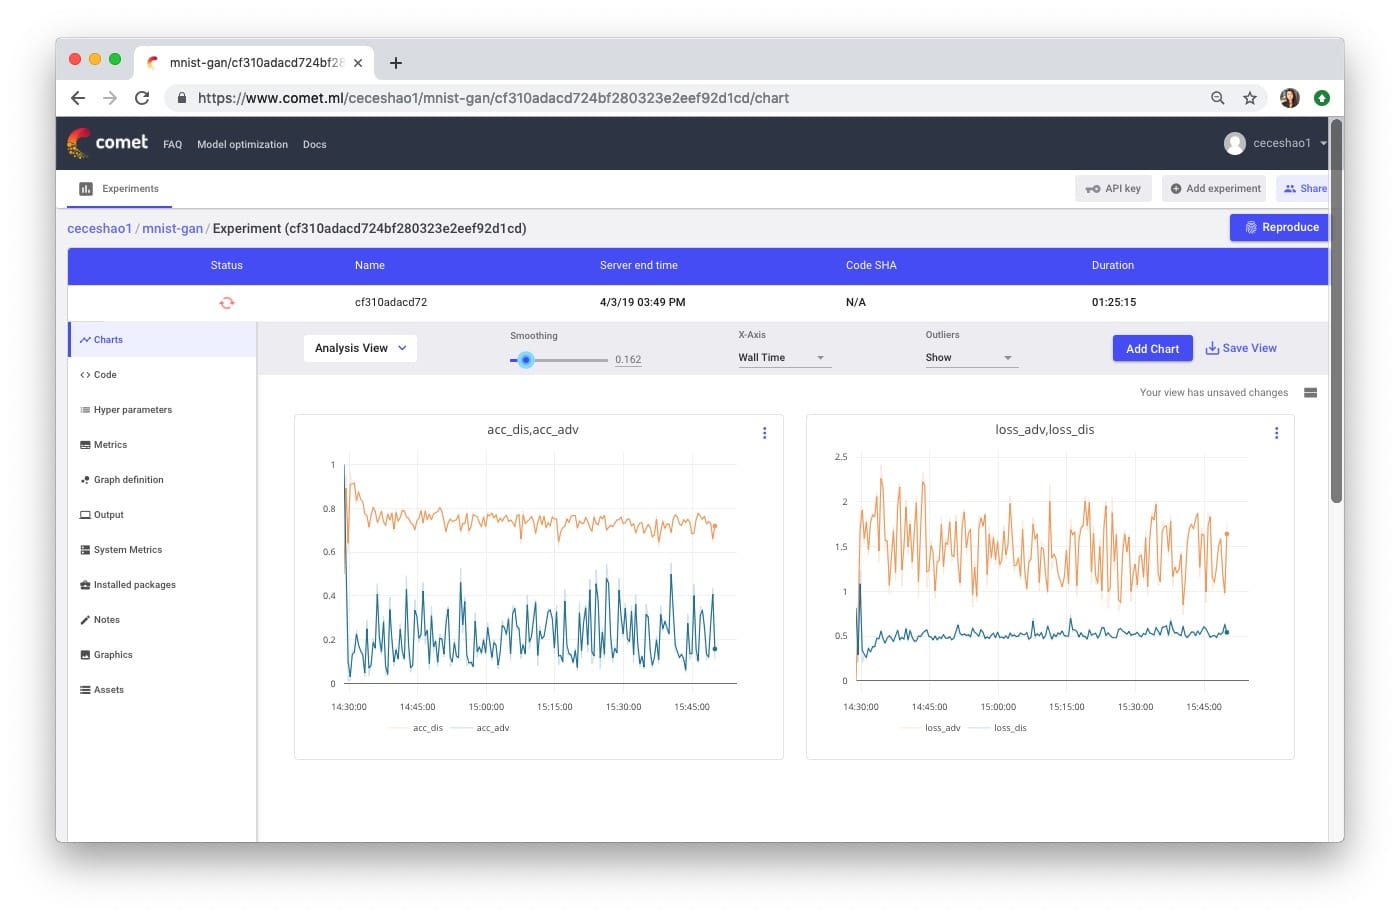
We can useComet.mltrackgenerator和DiscriminatorThe training progress of the model.
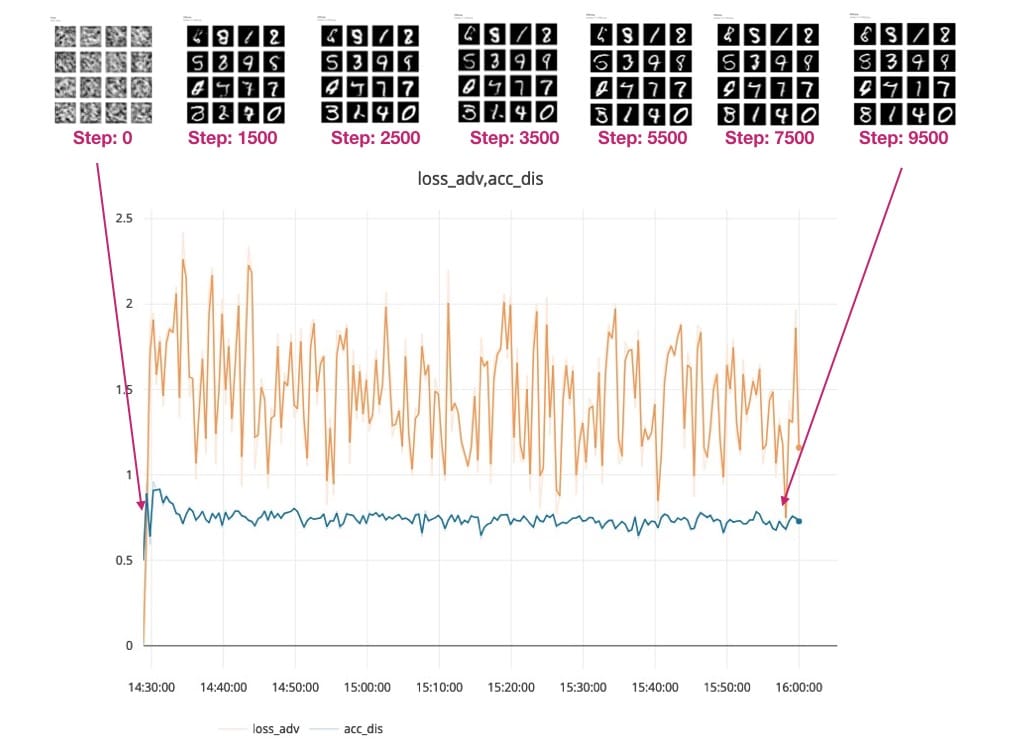
We are plotting the accuracy and loss of the discriminator and adversarial model-the most important metrics to track here are:
- The loss of the discriminator (see the blue line in the picture on the right) – Dis_loss
- The accuracy of the adversarial model (see the blue line in the left image)- Acc_adv
please atHereView the training progress for this experiment.
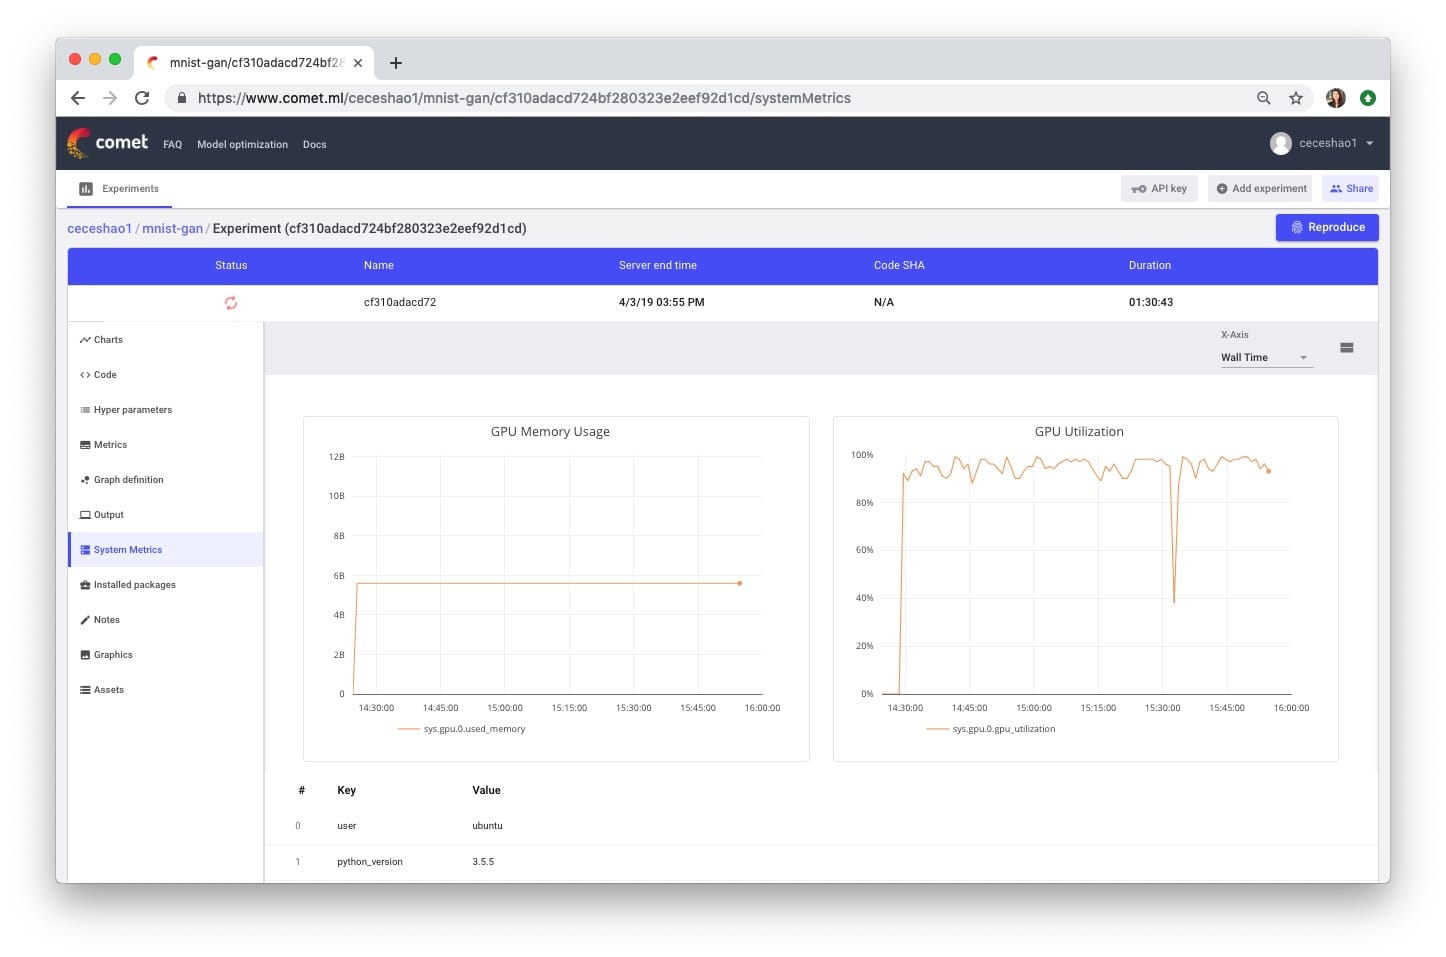
You also need to confirm if your training process is actually in use.GPUYou canView in the Comet System Metrics tab.
You noticed that our for loop training includes code to report images from test vectors:
if i % 500 == 0:
        # Visualize the performance of the generator by producing images from the test vector
        images = net_generator.predict(vis_noise)
        # Map back to original range
        #images = (images + 1 ) * 0.5
        plt.figure(figsize=(10,10))

        for im in range(images.shape[0]):
            plt.subplot(4, 4, im+1)
            image = images[im, :, :, :]
            image = np.reshape(image, [28, 28])

            plt.imshow(image, cmap='gray')
            plt.axis('off')

        plt.tight_layout()
        # plt.savefig('/home/ubuntu/cecelia/deeplearning-resources/output/mnist-normal/{}.png'.format(i))
        plt.savefig(r'output/mnist-normal/{}.png'.format(i))
        experiment.log_image(r'output/mnist-normal/{}.png'.format(i))
        plt.close('all')
Part of the reason we want to report the generated output every few steps is that we can visually analyze the performance of our generator and discriminator models in generating realistic handwritten numbers and correctly classify the generated numbers as "real". "or "false", respectively.
Let's take a look at these generated outputs!OnIn this Comet experimentView your own generated output
You can see how the Generator model starts with this fuzzy gray output (see 0.png below), which doesn't look like the handwritten numbers we expect.
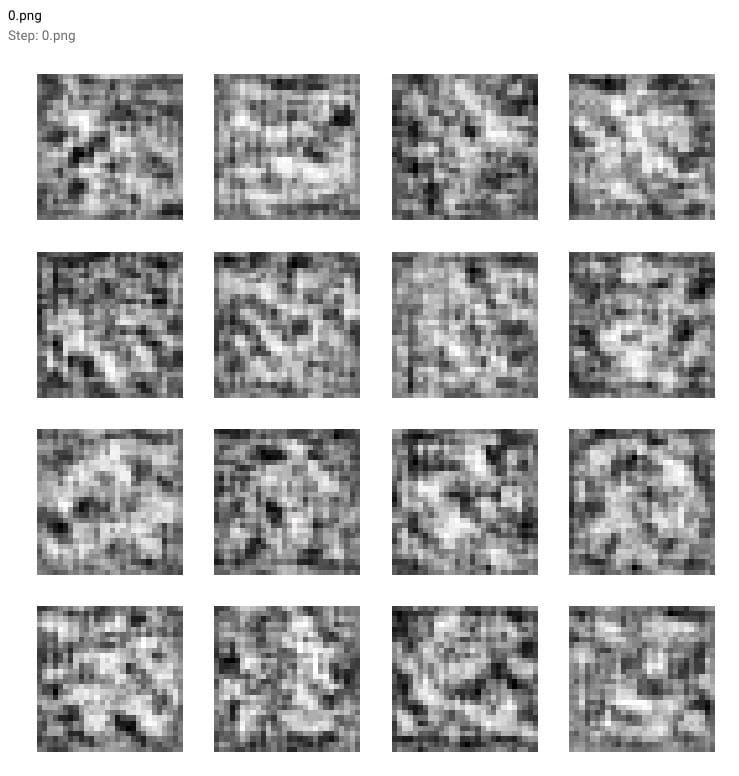
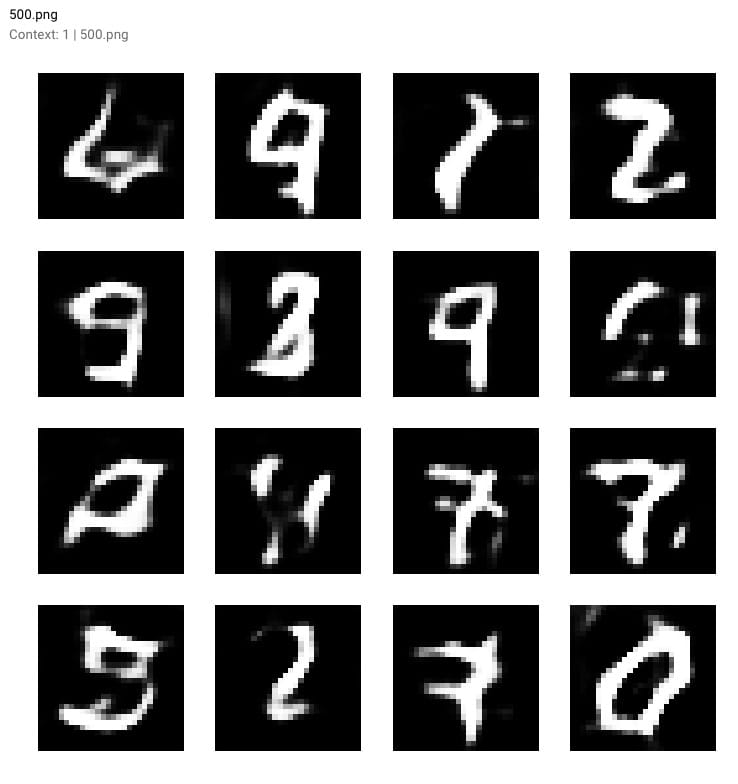
As the training progresses and the loss of our model decreases, the resulting numbers become clearer. View the generated output:
step 500:
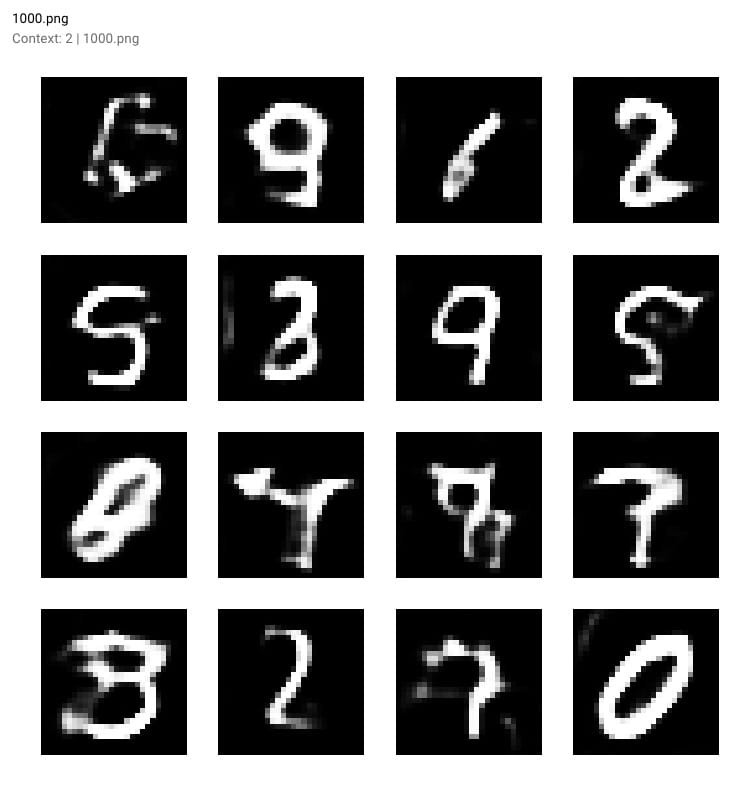
step 1000:
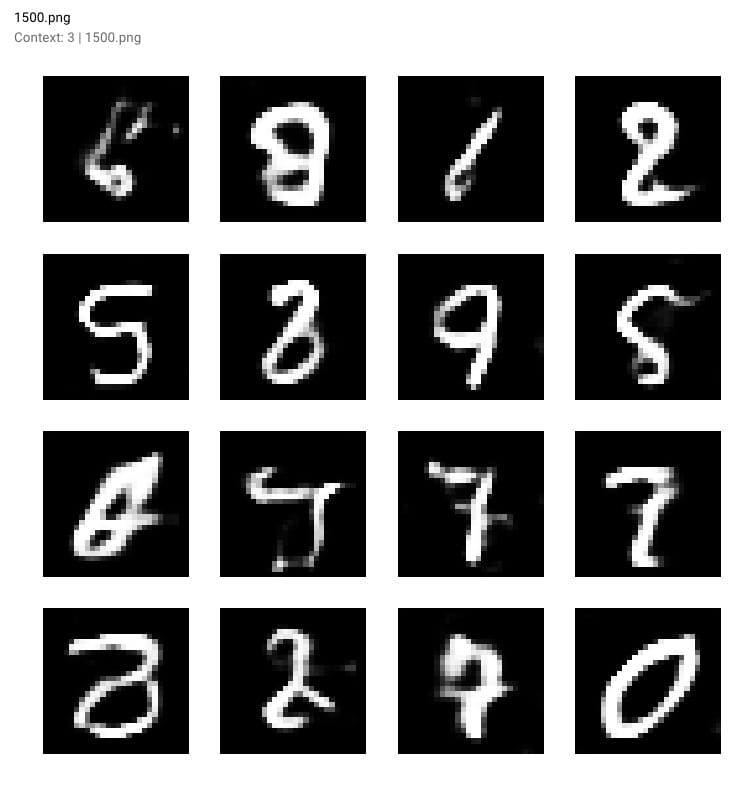
step 1500:
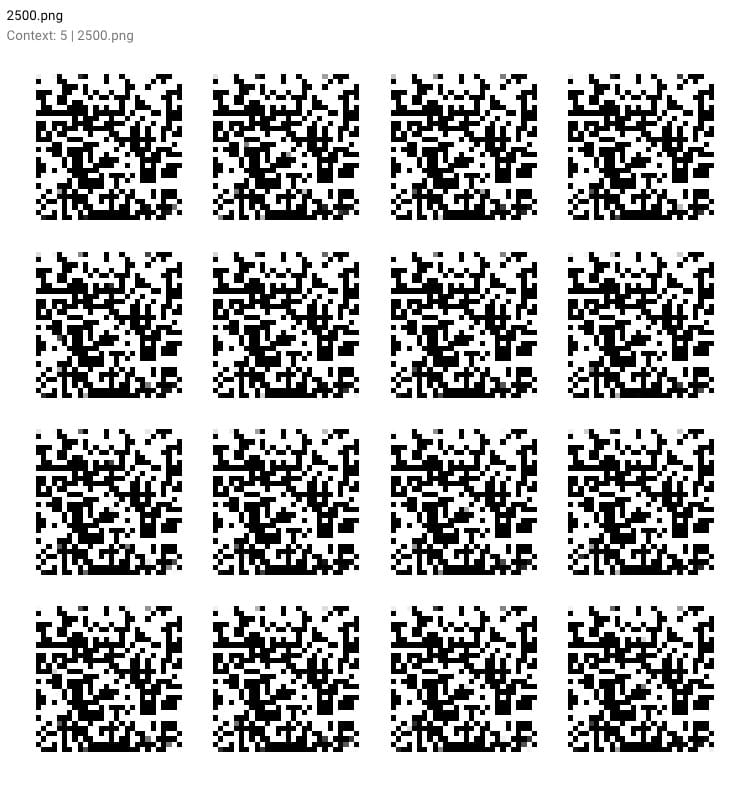
Finally atStep 10,000- You can see some samples of GAN generated numbers in the red box below.

Once our GAN model is finished training, we can evenComet's graphics tabView the output of our report as a movie (just press the play button!).

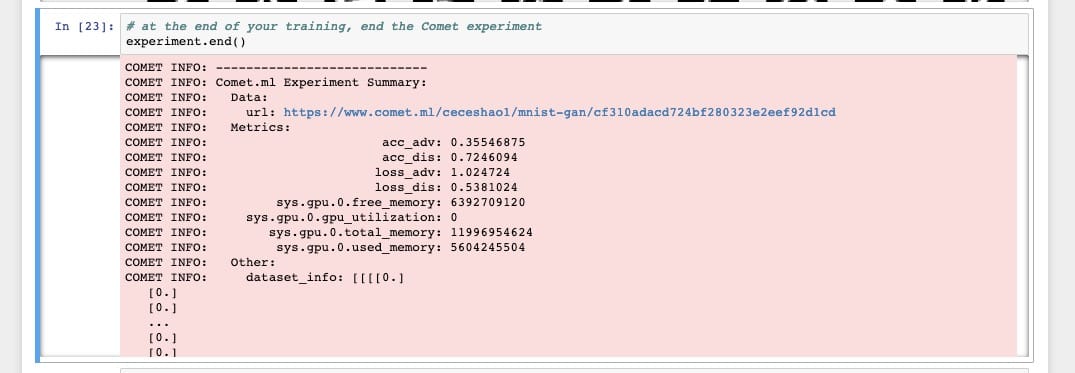
To complete the experiment, make sure to runexperiment.end()To see some summary statistics about model and GPU usage.
Iterate your model
We can train the model for a longer time to see how it affects performance, but let's try to iterate with a few different parameters.
Some of the parameters we use are:
- Discriminator optimizer
- Learning rate
- Dropout probability
- Batch size
From WouterIn the original blog postHe mentioned his efforts in testing parameters:
I have tested both
SGD.RMSpropandAdamFor the optimizer of the discriminator butRMSpropBest performance.RMSpropUse a low learning rate and I limit the value between -1 and 1. A small attenuation of learning rate can help stabilize
我们将尝试将鉴别器的丢失概率从0.4增加到0.5,并增加鉴别器的学习率(从0.008到0.0009)和生成器的学习率(从0.0004到0.0006)。很容易看出这些变化如何失控并难以追踪……🤯
To create a different experiment, just run the experiment to define the cell again.CometWill send you a new URL for your new experiment! Tracking your experiment is great, so you can compare the differences:
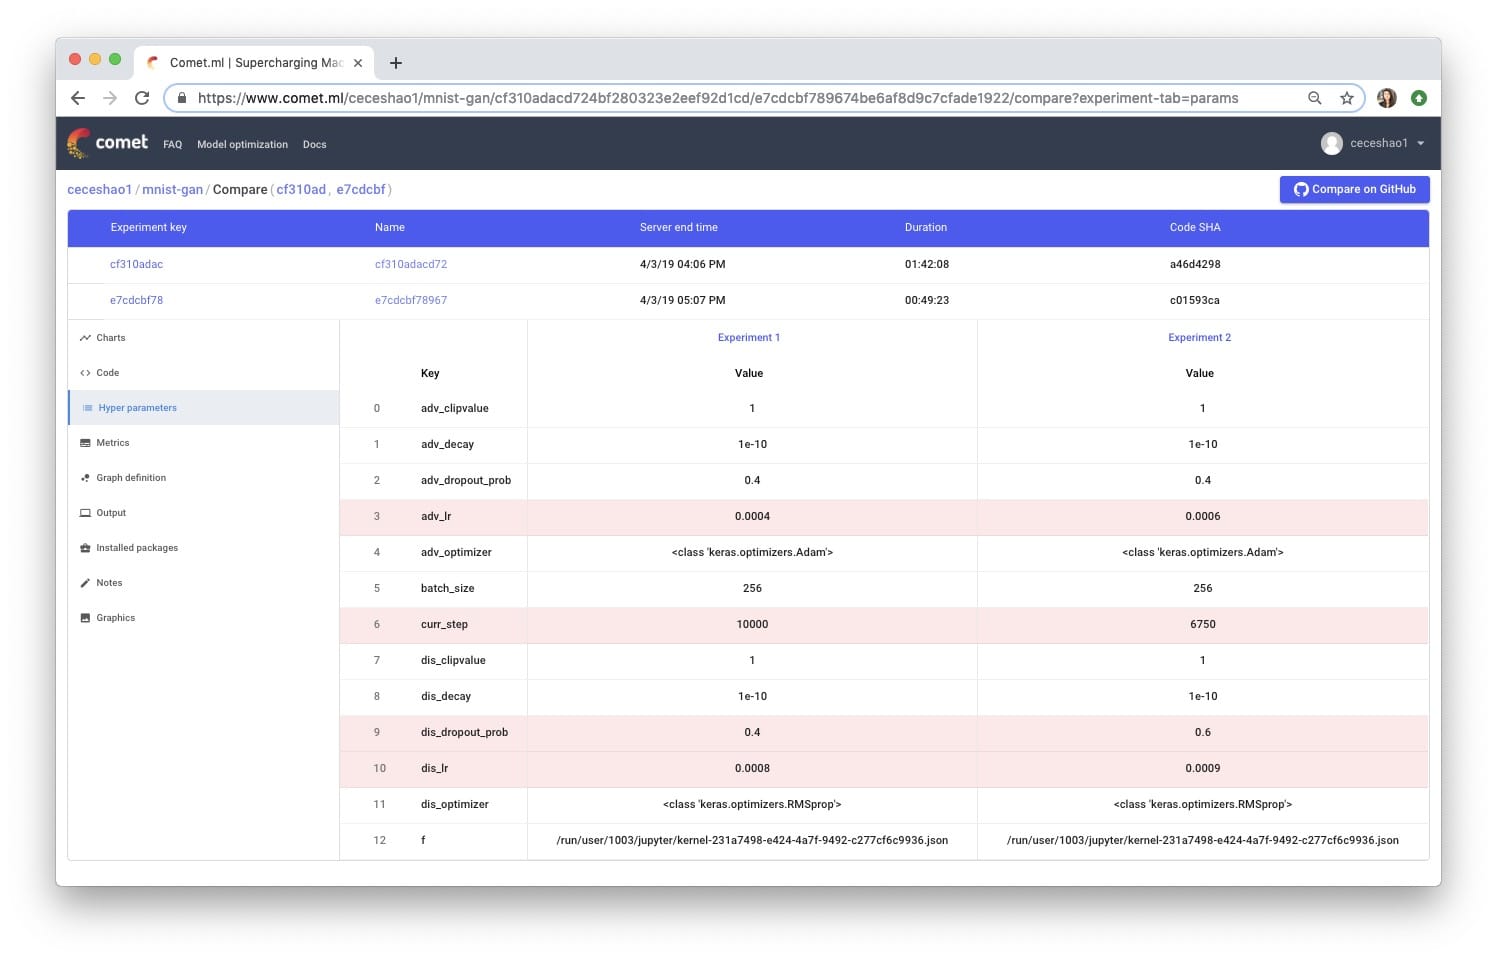
Unfortunately, our adjustments did not improve the performance of the model! In fact, it produces some funky output:
This is the content of this tutorial! If you like this article, please feel free to share it with friends who may find it useful😎
This article was transferred from awardsdatascience,Original address

Comments